Similar to the concept of variable dimensions, you might want to analyze a different measurement or type of measurement given the same dimensions. For example, when comparing organizations’ employee review scores, you might want to look at average scores to get a general feel of where each group sits vis-à-vis the others. But you might also want to look at the statistical standard deviations of those scores. (This gives you a metric of whether most people in a group score similarly or if there are big differences between people in that group.) With Vista you can easily create Analytics to choose your metric.
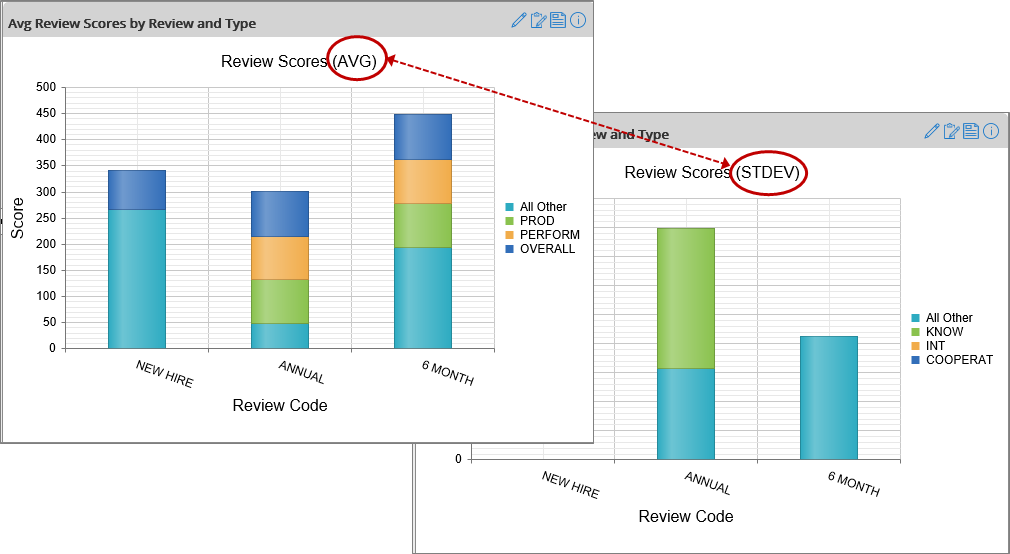
Analytics can be set up to allow users to quickly switch their aggregation calculations to display different facets about the same data. In this example, enabling the user to switch between averages and statistical deviations provides for a more complete picture of employee reviews.
Review previous article in the series: Variable Dimension Analytics
Go to next article in the series: Drillable Analytics
Go to beginning of the series: Introduction
Marco Padovani
Senior Development Manager
mpadovani@pdssoftware.com