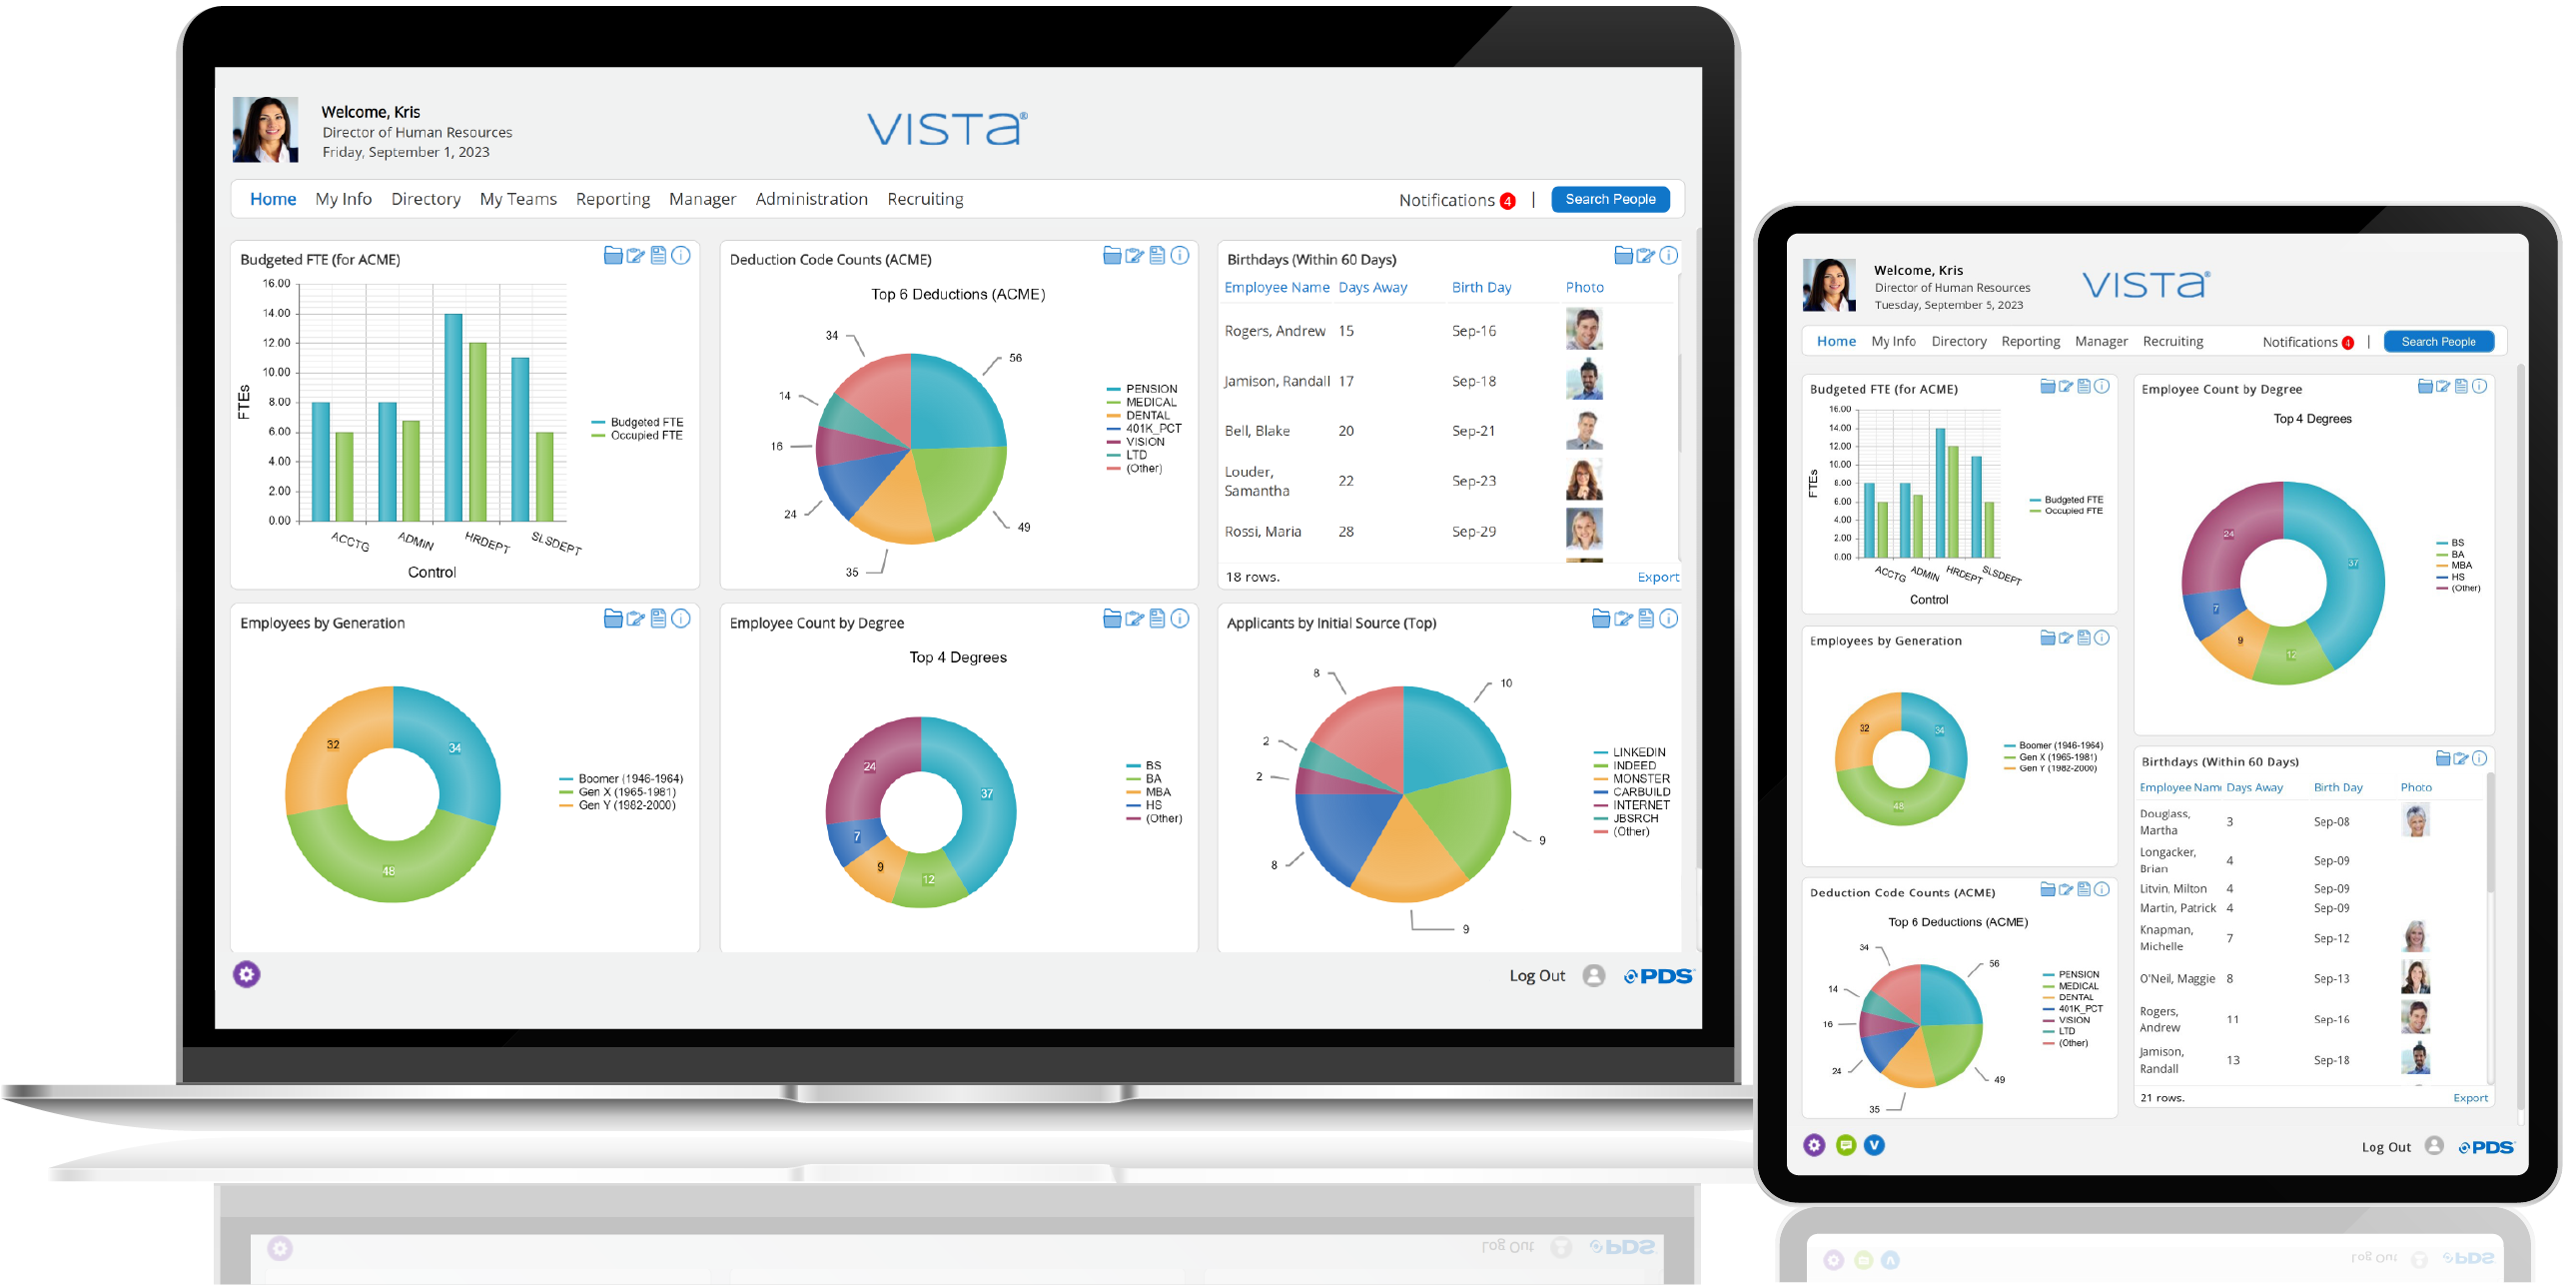
Analytics Built to Empower
The data within Vista® is a gold mine for high-value decision-making.
Organizations like yours need to measure and analyze that data
for strategic corporate success. With our Vista Analytics component,
you can easily streamline this information into vital decision-making recources.

Analytics Features That Make Your Job Easier
Our Analytics features are built to empower you and put you at the core of everything we do. We deliver the solutions to help you gather data from across your enterprise, and present it in a more engaging, meaningful way. Replace hard-copy reports with graphics that make sense to the people that need to know, but don’t want to hunt around to find it.
Collect the Data That Can Help You Make Decisions
Key performance indicators are a measurable value that can help you demonstrate how effectively your company is achieving key business objectives. Vista Analytics includes the features to define, schedule and collect data over time so that you can begin to analyze, report, and begin to truly identify trends within your organization. And it’ll make you look good!
Replace Those Old Reports with Actionable Content
No more hard-copy reports. Now you can easily deliver summarized data in a meaningful pie chart, if that makes sense. Or if your content contains columns of data, then list your data grouped the way you need it. Click into the data to drill-down and get to a more detailed list, or even open an employee page to edit the corresponding data. Yes, with a single click you can get to where you need to go. And if you want the data in a spreadsheet, you can export the data with one click! How easy is that?
Not convinced yet? Here are more reasons that you need to explore Vista Analytics further:
Empower your users
- Provide users with secured, relevant, engaging dashboards
- Content is user-defined so managers choose content that they want to see
- Simplify their navigation to get users to their “to-do” list
- Data audits and alerts can be easily viewed
- Give line managers the data that they need
Out of the box features to get you started
- Over a hundred predefined analytics that can be easily adapted
- A variety of dashboards to present results in different ways
- Various graph options are available (line, column, pie, scatter, stacked column)
- Configure the data that you want to include and export it
Key Performance Indicator (KPI)
- Automatically collect statistical data in your organization for reporting and later analysis
- Completely configurable to capture the data that you need
- Start collecting data that you don’t have today
- Samples include KPIs such as turnover statistics by month, overtime activity by distribution, and the number of applications received each day
- You define the data that your business drivers demand
Integrated technology and services
- Advanced metrics and analysis screens
- Dashboards of actionable analytics
- Vista Analytics training
- General HR analytics, statistics, and modeling training
- Structured PDS issue-to-solution consulting cycle

What Our Staff Say
“Analytics has to be my favorite part of Vista. I love how it gives our users real-time data, with real-time answers. Getting to the data you need has never been easier – drill down to edit data or one-click to export data from Analytics. ”
– Steve Fitzgerald, CEO, PDS